Your Aura Photo and Charka Image – Explanation of Report Graphs
The following bio-data graphs and meters are included on each personalized Aura Photograpy and Chakra Image report. Each details an aspect of your energetic body system.
The Mind-Body-Spirit Graph provides an overview of how your energies are currently distributed between Mind, Body, and Spirit.
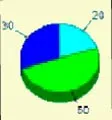
- Mind – Green = Your focus on creative, mental, and communicative endeavors.
- Body – Dark Indigo = Your focus on physical reality and activities
- Spirit – Light Blue = Your focus on spirituality, personal development, intuition, and inner awareness.
Your Level of Relaxation Graph
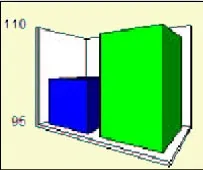
This graph illustrates you physical relaxation or stress level, which is primarily based on your body temperature. The left blue bar is a baseline reference, based on the environment. The green bar and left top numeric value show your personal relaxation level. 110+ indicates a very relaxed state and 90-100 an average relaxation level. Levels below 85 usually indicate high physical stress, low circulation, and low physical energy.
Your Energy Level Graph
The energy level graph shows the different energy channels that are measured and is based on your electro-dermal activity.
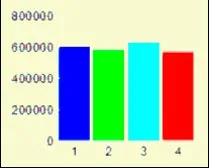
- The Indigo Bar (1) represents your Intuitive Energy.
- The Green Bar (2) represents your Mental Energy. The
- The Light Blue Bar (3) represents your Emotional Energy.
- The red bar (4) represents your Physical Energy.
Even bars indicate that the different energy channels are flowing in harmony and each part of your system is vibrating at the same frequency.
Uneven bars show that there is disharmony in your energy flow and part of your system may be out of balance.
The Values indicate your vibrational rate, ranging from a value of 10,000 to 1,500,000:
1,500,000 -800,000 Extremely High Vibration Range ~ More grounding and focus is needed
800,000-500,000 High Vibration Range ~ Great for intuitive and sensitive activities. More grounding and focus is recommended.
500,000 -250,000 Medium Vibration Range ~ Great for daily activities. Shows mind-body-spirit balance.
250,000 -70,000 Low Vibration Range ~ Great to achieve goals and recharge your energy. Relaxation is also advised.
70,000-10,000 Very Low Vibration Range ~ Increasing sensitivity and energy level needed.
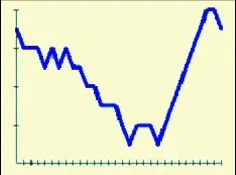
The Emotiometer shows your emotional reactions, true thoughts and inner feelings. Real-time graphic indicators display immediate response of true feelings and thoughts during your session. The horizontal axis represents time while the vertical axis indicates the range of emotions. Sharp spikes, or rises and falls in the line, graphs emotionally charged, stressed, and agitated thoughts as well as high excitement or nervousness. A straight line depicts a very centered, non-emotional state.
The Color Wheel illustrates the entire aura chakra image color range. Two needles, like clock hands, are overlaid on the wheel. The short needle reflects your Yin, female, and left side qualities of your energy system. The long needle represents your Yang, male, and right side energies.
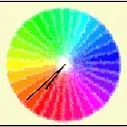
When the needles are closely aligned, your Yin-Yang energies are in balance. The more the needles separate, the more disharmony and imbalance between your Yin-Yang/male female energies. If the needles form an angle greater than 45 degrees, you may feel tension in one side of the body as well.
